
Analyzing CAN Data
This guide walks through the core workflow for analyzing CAN data in SeerWatch: load a log, decode it with a DBC, plot signals, and filter the trace down to what matters.
New to SeerWatch? The Quick Start covers the same ground in under a minute using the demo data.
Viewing CAN Logs
Section titled “Viewing CAN Logs”Open the ⚙ Settings panel and click 🖹 Load Log to select a log file.
SeerWatch reads .log and .asc files. See Supported Log Formats for details on both.
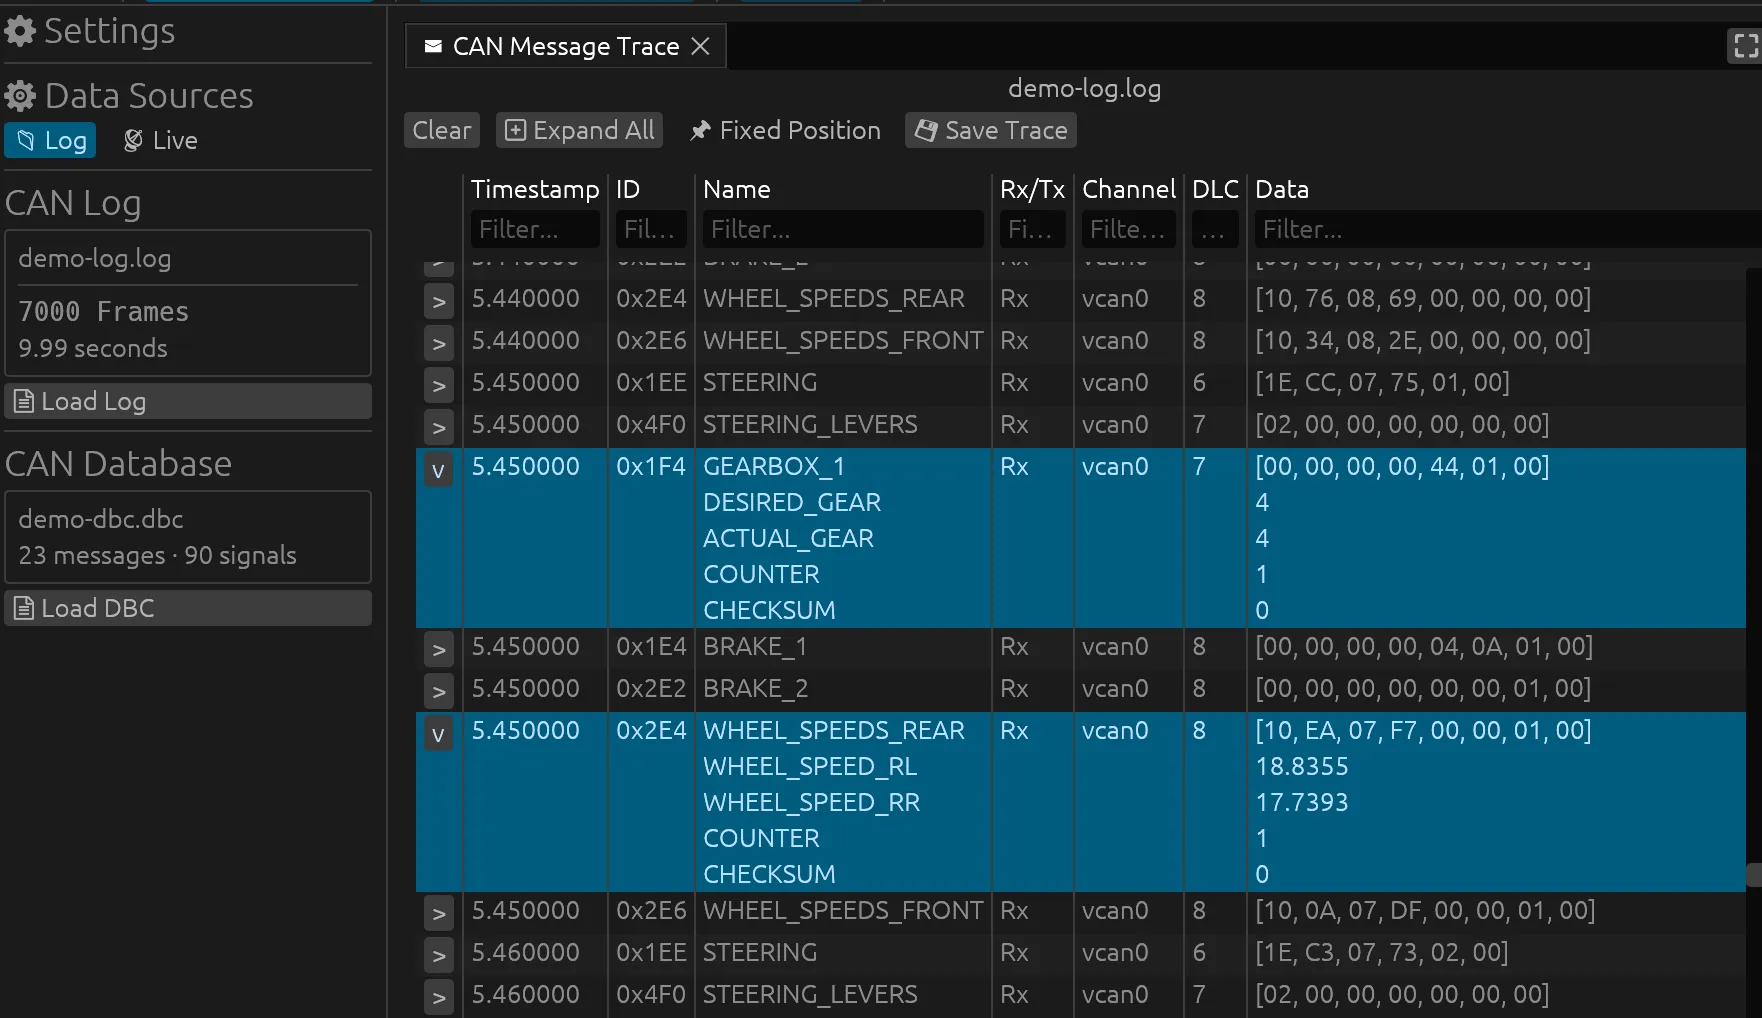
Once loaded, the CAN Message View fills with every frame from the log. All the CAN fields are included: timestamp, arbitration ID, name (once a DBC is loaded), direction, channel, DLC, and raw data bytes.
Decoding with DBC files
Section titled “Decoding with DBC files”A log file on its own only gets you raw hex. To see real signal values, load a DBC:
- open ⚙ Settings, then click 🖹 Load DBC under CAN Database.
Once a DBC is loaded, SeerWatch matches each frame’s CAN ID to a message definition and decodes it by applying scaling, offset, and units automatically.
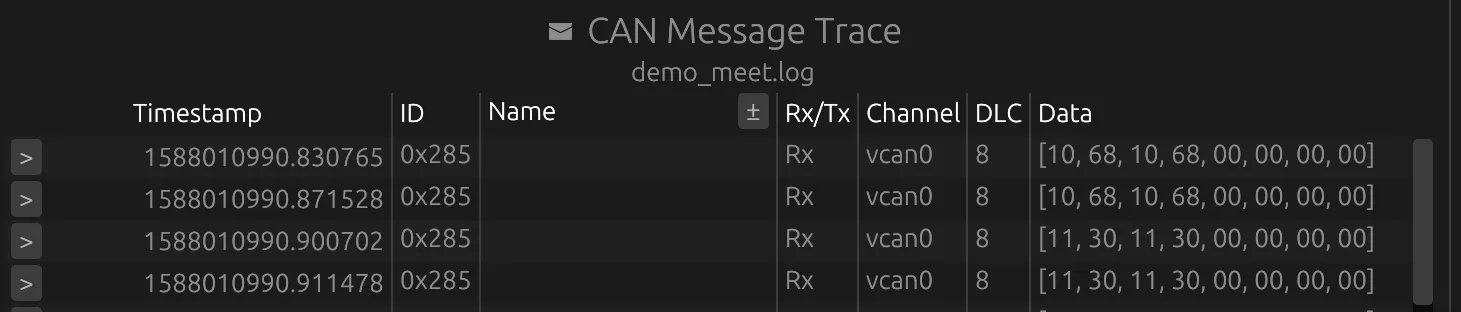
Click the > expand arrow on any row to see its decoded signals

or use Expand All in the toolbar to open every row at once.
Plotting signals
Section titled “Plotting signals”Every decoded signal appears in the Available Signals list in the Charts view. Click a signal to add it to the plot.
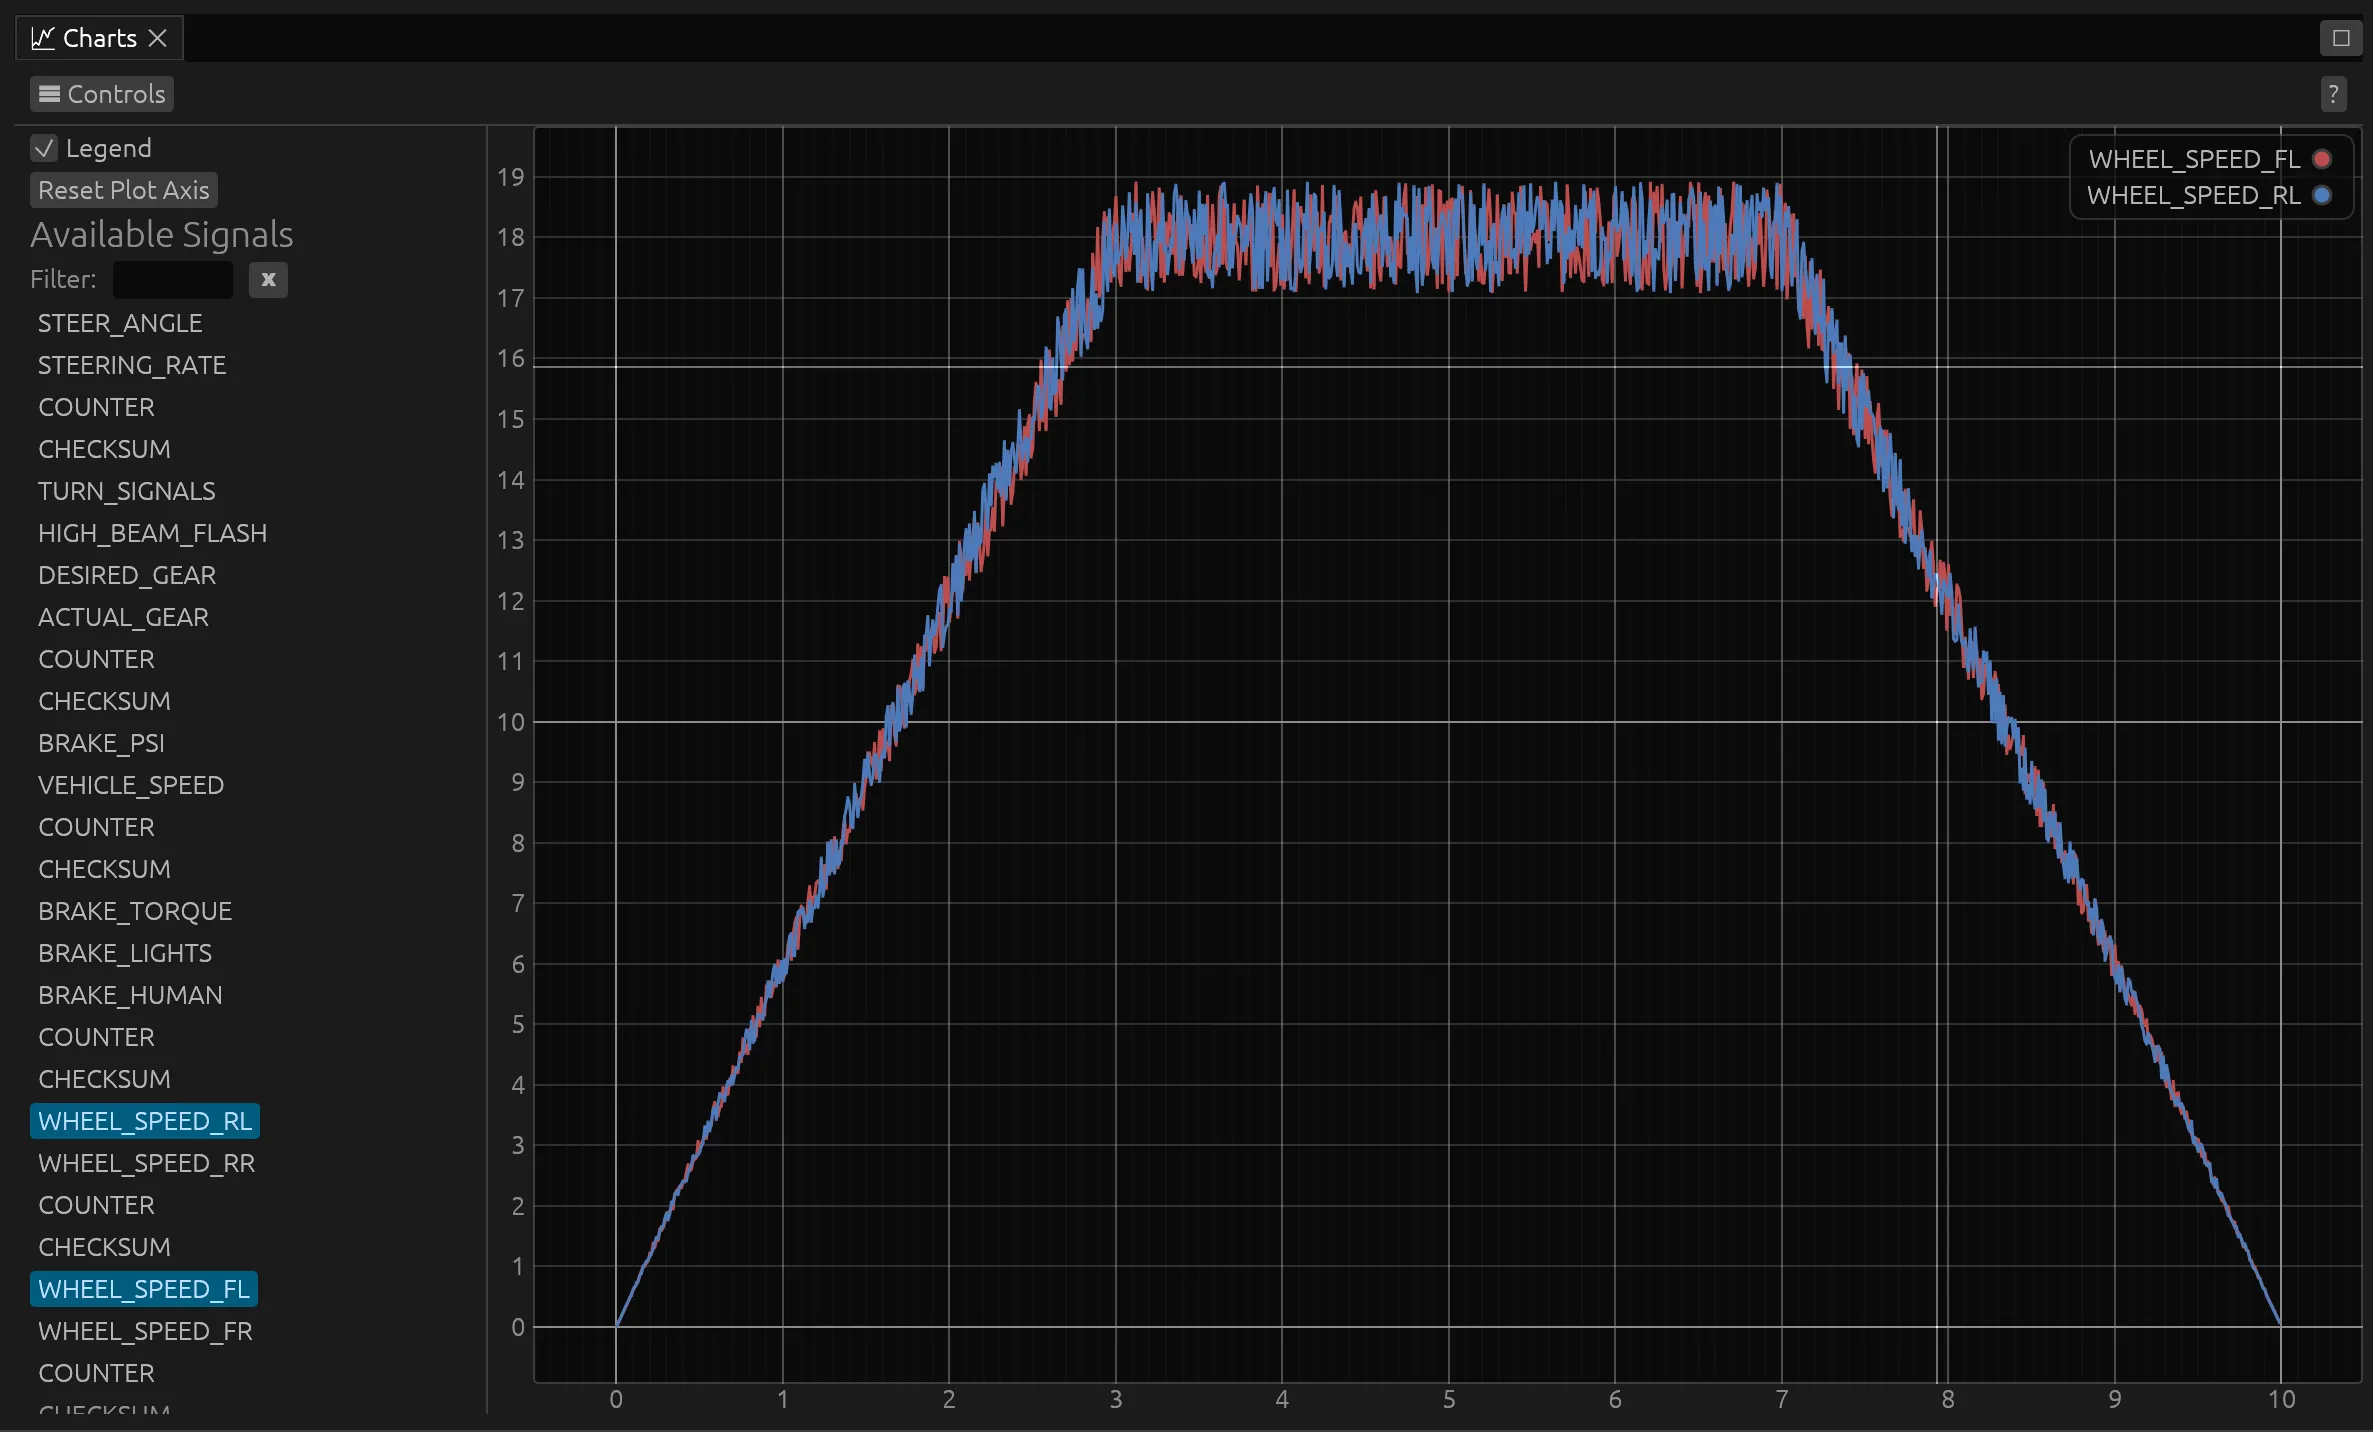
- Overlay multiple signals — You can plot multiple signals together to spot correlations.
SeerWatch downsamples plotted signals intelligently so large datasets stay smooth. Your chart won’t bog down even on logs with millions of points.
Chart interaction
Section titled “Chart interaction”You can zoom, pan, and scroll the chart to focus on the section that is most interesting.
| Action | Control |
|---|---|
| Zoom | Ctrl + Scroll |
| Box zoom | Right click + drag |
| Pan | Left click + drag |
| Pan up/down | Scroll |
| Pan left/right | Shift + Scroll |
| Reset axes | Double click |
Filtering the trace
Section titled “Filtering the trace”Each column in the CAN Message View (Timestamp, ID, Name, Rx/Tx, Channel, DLC, Data) has its own filter field.
- Type a value to show only matching rows
- Filters take comma-separate values to OR them within a column (e.g.
100, 200on ID shows frames with either ID). - Filters across different columns are combined with AND

When a filter is active the toolbar will display Showing X / Y to indicate how many messages match the filter out of the total number of messages. Click Clear Filters button to reset everything at once.
Scrolling vs. Fixed Position
Section titled “Scrolling vs. Fixed Position”Each incoming message is appended to the message view, and the view scrolls to display the latest messages.
📌 Fixed Position: For high-traffic buses, toggle Fixed Position to pin each message to a single row instead of scrolling. New frames for the same ID overwrite the previous value in place, making it easier to watch specific messages update live.